







Normal Blood Sugar by Age: Levels, Ranges, and How to Keep Yours in Check
Authored by
The Evolv Research Team
Your fasting glucose came back at 96. Or 102. Or your A1c at 5.7%. Your doctor says it’s fine. The chart you found online says you’re “borderline.” Reddit says one number is great and another is a warning shot. What’s actually going on?
The honest answer is that normal blood sugar by age barely changes at all. The same diagnostic thresholds apply across adult age groups. What changes is your body’s flexibility around those thresholds: the post-meal response widens a little with each decade, even in healthy aging.
That distinction matters because the standard advice, “you’re not diabetic, keep doing what you’re doing,” leaves a real gap for the metabolically aware adult who wants to stay that way. There’s the not-diabetic zone, and there’s the metabolic-health-optimal zone. They’re not the same. And the levers between them are well-studied.
Here’s the reference chart, the aging biology behind why guidance shifts, what your body’s natural GLP-1 hormone does for the post-meal response, and the four lifestyle levers that move the needle most.
The reason this matters now: supporting your body’s natural metabolic pathways, including GLP-1, your gut’s post-meal coordinator, has more than one form. Most of the conversation has centered on prescription GLP-1 medications. There’s another lane.
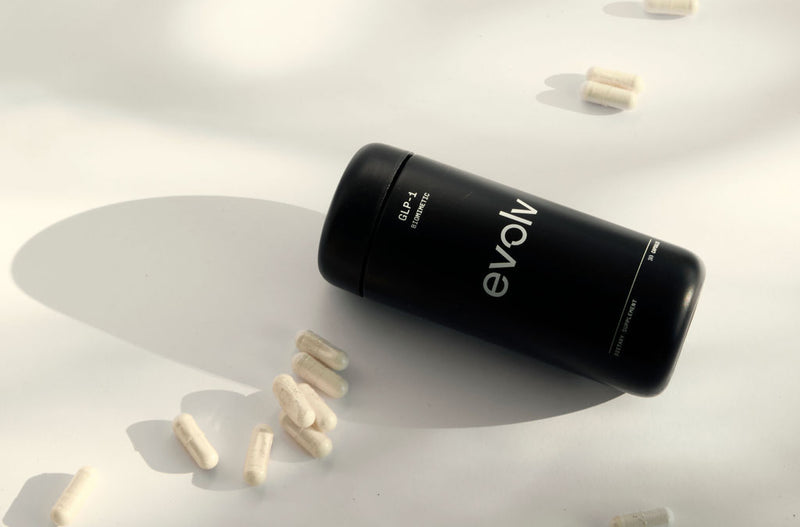
Evolv GLP-1 is a natural biomimetic dietary supplement built around a proprietary yeast-derived peptide designed to support GLP-1 and GIP appetite pathways.
Its active ingredient, the bioengineered, yeast-derived EV1 Peptide, is designed to support your own GLP-1 and GIP appetite pathways through a daily oral tablet. GLP-1, the hormone, is made in your gut and exists only there; no product carries it. What a GLP-1 product does is work on that pathway, and the EV1 Peptide is Evolv’s way of doing it: a distinct molecule designed to support the signaling pathways your gut already runs.
Normal Blood Sugar by Age: The Reference Chart
Normal blood sugar varies by when and what you’ve eaten, not primarily by age. The same diagnostic thresholds apply across adult age groups: fasting glucose 70–99 mg/dL is normal, 100–125 mg/dL is prediabetes, and 126 mg/dL or higher indicates diabetes (per NIH StatPearls).
What does shift with age is the body’s flexibility around those thresholds. The post-meal response widens slightly even in healthy aging, and HbA1c upper reference limits drift up a few tenths of a percent across decades.
Blood Sugar by Age Bracket: Quick Reference
This is the chart most people came here for: typical reference ranges by adult age group, plus the HbA1c upper reference limit that does actually shift with healthy aging.
|
Age Group |
Fasting Glucose (mg/dL) |
Post-Meal 2-Hour (mg/dL) |
HbA1c Upper Reference (%) |
Key Context |
|
20–39 (adults) |
70–99 |
<140 |
≤6.0 |
Standard ADA range; same as younger adults |
|
40–59 (midlife) |
70–99 |
<140 |
≤6.1 |
Slight HbA1c drift; body composition is the dominant lever |
|
60+ (older adults) |
70–99 |
<140 |
≤6.5 |
Higher HbA1c can reflect normal aging, not prediabetes |
Source: NIH StatPearls (NBK555976) for the diagnostic ranges; Masuch et al., BMC Endocrine Disorders 2019, for age-specific HbA1c upper reference limits.
Diagnostic Thresholds vs. Metabolic-Health Optimal
The same ranges, shown side-by-side with the longevity-research “optimal” targets. The “Diagnostic Normal” column is the ADA standard, the threshold below which a clinician considers your numbers unremarkable. The “Metabolic-Health Optimal” column reflects where longevity-focused researchers and clinicians point as wellness targets for adults aiming to support healthy metabolic aging. The optimal column is a wellness benchmark, not an official medical guideline.
|
Measure |
Diagnostic Normal (ADA) |
Metabolic-Health Optimal |
Prediabetes |
Diabetes |
|
Fasting glucose (mg/dL) |
70–99 |
70–89 |
100–125 |
≥126 |
|
Post-meal 2-hour (mg/dL) |
<140 |
<120 |
140–199 |
≥200 |
|
HbA1c (%) |
<5.7 |
<5.4 |
5.7–6.4 |
≥6.5 |
A note on age and HbA1c specifically: research from Masuch and colleagues (BMC Endocrine Disorders, 2019; n=1,804) found that HbA1c upper reference limits in healthy non-diabetic adults rise gently with age, approximately 6.0% for ages 20–39, 6.1% for ages 40–59, and 6.5% for ages 60+. A 5.9% HbA1c in a 65-year-old is not automatically prediabetic; it may reflect normal aging. The same single-threshold guideline that flags a younger adult appropriately can over-flag a healthy senior.
This is why context matters more than any chart. Numbers in the diagnostic-normal range with healthy lifestyle markers around them mean something different from the same numbers paired with rapid weight gain, fatigue, or family history.
Why Glucose Tolerance Shifts With Age
Even in healthy adults, the post-meal glucose response widens a little with each decade. The reason is less about pancreatic decline and more about three structural shifts in the body that change how it handles a meal.
Body Composition: The Dominant Lever
The single biggest variable in age-related glucose change is body composition, not chronological age. In the Baltimore Longitudinal Study of Aging (Chia, Egan, and Ferrucci; Circulation Research, 2018; n=230), the raw age-related rise in 2-hour postprandial glucose averaged 5.6–6.6 mg/dL per decade. After adjusting for BMI, that rise dropped to 0.03–0.5 mg/dL per decade, effectively zero.
Translation: most of what looks like “blood sugar rising with age” is actually changes in muscle and adiposity, not the calendar. Lean muscle mass is the body’s primary glucose sink, and skeletal muscle accounts for the majority of insulin-stimulated glucose uptake via the GLUT4 transporter. Losing muscle reduces glucose clearance capacity. And resistance training builds it back: a 2013 study by Croymans and colleagues (Journal of Applied Physiology) found that 12 weeks of resistance training (three sessions per week) in sedentary adults increased muscle GLUT4 expression by 26%, HK2 by 28%, and AKT2 by 33%, driving meaningful gains in muscle insulin sensitivity without weight loss.
Peripheral Insulin Sensitivity, Not the Pancreas
The same Chia 2018 data showed that older adults need substantially more insulin to clear the same glucose load: half-maximal glucose uptake required 54 mU/mL insulin in young adults compared to 113 mU/mL in older adults. That’s the body’s insulin-glucose dose-response curve shifting to the right with age, the textbook signature of peripheral insulin resistance.
What’s surprising is what didn’t change: glucose-stimulated insulin secretion was relatively preserved across age groups. The pancreatic beta cells were still doing their job. The shift is in the tissues that respond to insulin, muscle and adipose, becoming less responsive over time.
The implication for what you can do about it: levers that improve muscle insulin sensitivity (resistance training, post-meal movement) and levers that smooth the post-meal demand on the system (meal sequencing, sleep) are more directly targetable than the pancreas itself.
Why HbA1c “Allowed Normal” Drifts Up Without Disease
HbA1c rises gently in healthy aging because red blood cell turnover slows slightly and average glucose exposure ticks up. Both are physiological changes, not pathological ones. The Masuch 2019 work establishing age-stratified upper reference limits is a direct response to a known problem: the single-threshold HbA1c guideline correctly flags younger adults but over-flags healthy seniors as borderline.
For a 65-year-old, a 5.9% HbA1c sits inside the healthy-aging reference range. For a 35-year-old, the same number is closer to the high end of normal and warrants more attention. Context and a conversation with your doctor about your individual history matter more than where any single number falls on a chart.
What GLP-1 Actually Does for Post-Meal Glucose
GLP-1 (glucagon-like peptide-1) is a hormone your gut releases within minutes of eating. It’s the body’s coordinator of the post-meal response, telling the pancreas when to release insulin, slowing gastric emptying, and signaling fullness to the brain.
As Evolv co-founder Becca McCarthy described on the Mom Curious podcast: “When you eat, your body produces the GLP-1 hormone. That hormone meets its receptors and those receptors signal to various organs in your body, your pancreas, your stomach, your brain, your liver, and tell them what to do because you’ve now consumed food and you’re full.”
The biology behind that summary is three coordinated mechanisms, documented in peer-reviewed work by Müller and colleagues (Molecular Metabolism, 2019) and Reed and colleagues (F1000Research, 2020):
- Glucose-dependent insulin secretion. GLP-1 amplifies insulin release only when blood glucose is elevated, which minimizes the risk of pushing glucose too low.
- Glucagon suppression. GLP-1 quiets the liver’s glucose-production signal during meals, preventing the “double up” effect where the body floods the bloodstream with both dietary and hepatic glucose at the same time.
- Gastric emptying delay. GLP-1 slows the movement of nutrients out of the stomach, spreading glucose absorption over time and flattening the post-meal peak.
Healthy GLP-1 signaling is part of why a metabolically resilient 30-year-old’s post-meal glucose curve is flatter than the same person’s curve at 60. Supporting that signaling through diet, lifestyle, and for some, supplementation, is one of the most direct levers on post-meal glucose stability. For the foundational explainer on what GLP-1 actually is and why it matters, that’s the deeper dive.
Four Evidence-Based Levers to Keep Your Post-Meal Glucose in Check
The strongest lifestyle levers for healthy adults are well-documented in peer-reviewed work. Each addresses a different part of the post-meal response system.
1. Walk Within 30 Minutes of Eating
A 2023 systematic review and meta-analysis from Engeroff and colleagues (Sports Medicine; 8 randomized controlled trials, n=116) found that post-meal exercise reduced postprandial glucose excursions versus inactive controls (standardized mean difference 0.55, 95% CI 0.34–0.75). The effect was strongest when exercise began as soon as possible after a meal. Pre-meal exercise, by contrast, showed no significant benefit over inactivity.
Practical translation: 10–15 minutes of light walking starting within 30 minutes of finishing a meal, meaningfully smoothing the post-meal curve, especially after carbohydrate-heavy meals.
2. Lift Things: Resistance Training Builds Glucose-Disposal Muscle
The Croymans 2013 work referenced above is the headline citation here: 12 weeks of resistance training (three sessions per week) increased muscle GLUT4 expression by 26%, HK2 by 28%, and AKT2 by 33%. More glucose transporters in muscle means more glucose cleared per unit of insulin. The mechanism is structural. You’re building the tissue that does the work.
Practical: two to three resistance sessions per week, prioritizing full-body compound movements (squats, deadlifts, presses, rows). Body composition often takes precedence over weight on the scale for this purpose.
3. Sequence Your Meal: Protein and Fiber First
A 2016 study from Kuwata and colleagues (Diabetologia) found that eating protein (fish or meat) before carbohydrates (rice) reduced postprandial glucose AUC by approximately 4–9% in both healthy controls and adults with type 2 diabetes. Mechanism: protein and fiber slow gastric emptying and enhance natural GLP-1 and GIP secretion from intestinal L-cells. You’re using meal sequencing to amplify your body’s own incretin response.
Practical: within a single meal, eat the vegetables and fiber first, the protein second, the carbohydrates and starches last.
4. Protect Your Sleep: Insulin Sensitivity Depends on It
A 2016 randomized crossover study by Wang and colleagues (PLOS ONE) showed that even moderate sleep restriction, about 1.5 hours less per night, raised fasting insulin (p=0.034), increased insulin AUC by approximately 20% (p=0.037), and reduced the Matsuda insulin sensitivity index (p=0.014) in healthy young adults. The effect appeared without a proportional rise in fasting glucose, indicating the pancreas was compensating by producing more insulin to maintain the same glucose level.
That compensation has limits. Practical: 7–9 hours per night, consistent timing, dark room, screens away from bedtime. Sleep is a glucose lever, not just a recovery one.
How Evolv Supports Your Body’s Natural GLP-1 and GIP Pathways
Supporting GLP-1 signaling is one of the most direct levers on the post-meal glucose response, and there’s a growing category of products designed to do exactly that.
Biomimetics are biologically informed wellness products designed to engage human signaling pathways. Evolv GLP-1 is one biomimetic implementation, built as a daily oral tablet. The category was a structural gap in the supplement industry until recently. Most GLP-1 pathway support products relied on plant extracts that elicit short, indirect responses rather than engaging the signaling pathway directly.
Evolv GLP-1 is a natural biomimetic dietary supplement built around a proprietary yeast-derived peptide designed to support GLP-1 and GIP appetite pathways.
Its active ingredient is the EV1 Peptide, a bioengineered molecule designed to support your own GLP-1 and GIP appetite pathways through a daily oral tablet. In Evolv’s randomized controlled study, with results read out at 8 weeks, participants lost up to 12+ lbs, consumed approximately 750 fewer calories per day, and reported no harsh side effects or hair or muscle concerns.
Evolv works alongside the four levers above, on the pathway they all run through. The four behavioral levers remain the foundation, and supporting your body’s natural GLP-1 and GIP appetite pathways adds another structure-function lane on top of it. As host Daniela Ravani shared on the Mom Curious podcast about her own experience: “I realize now that food noise had a lot to do with my blood sugar fluctuations. But it also was a pattern in my body and in my brain and in my life, and it was disrupted by this technology.”
For more on how the biomimetic mechanism works, the broader GLP-1 longevity science, and how natural GLP-1 pathway support compares to other approaches, those are the dedicated walkthroughs. For natural ways to increase GLP-1 through diet and lifestyle, that’s the practical guide. For supplements to lower blood sugar more broadly and hormone balance and weight loss, the wider context of how insulin, cortisol, and GLP-1 interact in midlife; those are the companion pieces. For biomimetic supplements for metabolic health, the category explainer. For the underlying science, the Evolv science page is the source of record.
Which Products Support Healthy Blood Sugar With Age
Four of the most common questions people bring to this topic are some version of “what should I actually take?” The honest answer starts with a caveat: no product substitutes for the four levers above, and across most of the botanical shelf the evidence base is thinner than the evidence for walking after meals. What follows is the category sorted by mechanism, strongest first.
GLP-1 Pathway–Supporting Biomimetics
This is where the category meaningfully shifts. Biomimetics are pathway-based products designed to engage the body’s own signaling rather than supply a nutrient or force a short-term response. For post-meal glucose specifically, GLP-1 and GIP are the pathways that coordinate the response, which makes pathway support the most mechanistically direct option in this category.
Evolv GLP-1 is the implementation covered in the section above. What matters for evaluating any product in this lane: does it name the pathway it engages, is the mechanism explained rather than implied, and is there clinical data behind it.
Mineral and Nutrient Status
Not glamorous, and genuinely worth checking first. Magnesium and vitamin D status both track with insulin sensitivity in observational work, and both become more commonly insufficient with age. Correcting a real insufficiency can move the needle; supplementing on top of adequate status generally does not. This is a bloodwork question, not a shopping question.
Fiber and Meal-Timing Aids
Psyllium and other viscous fibers slow gastric emptying, which flattens the post-meal curve through the same mechanism as eating your vegetables first. That is a bulk effect on gastric emptying rather than engagement of the signaling pathway itself, and it does not replace the sequencing lever it imitates.
The Botanical Extracts You’ll See Marketed
Berberine, cinnamon extract, chromium, and green tea extract dominate the “blood sugar support” shelf. The research is inconsistent, effect sizes are small where they exist, and the National Center for Complementary and Integrative Health notes that evidence quality remains uneven, particularly for sustained outcomes. Berberine in particular can interact with medications and warrants a conversation with a healthcare provider first. These are not pathway-engaging products, and they are the reason the biomimetic category was developed in the first place. Treat them as context for the category rather than as recommendations.
How to Evaluate Any of Them
- Mechanism clarity. Can the product explain what it engages and how? Vagueness is the signal.
- Clear daily dosing. A defined daily serving you can actually stay consistent with.
- Tolerability. Something you can take every day without disruption is worth more than something stronger you abandon in three weeks.
- Real data. Published clinical work on the finished product beats mechanism theory and before-and-after photos.
None of this replaces a conversation with your physician, particularly if you take blood-pressure or blood-glucose medication, where several of these can have additive effects.
Frequently Asked Questions
What is a normal fasting blood sugar for adults?
A fasting plasma glucose of 70–99 mg/dL is considered normal for adults, 100–125 mg/dL is prediabetes, and 126 mg/dL or higher indicates diabetes (NIH StatPearls). Many longevity-focused clinicians point to an optimal range of 70–89 mg/dL for adults aiming to support healthy metabolic aging, though this is a wellness target, not an official medical guideline. Context matters: discuss your individual numbers with your doctor.
What is the average blood sugar for a 70-year-old?
There is no separate “average” blood sugar target for healthy 70-year-olds without diabetes. The same 70–99 mg/dL fasting reference range applies. However, HbA1c does rise slightly with healthy aging: research by Masuch and colleagues (BMC Endocrine Disorders, 2019) found upper reference limits of around 6.5% for adults 60+, compared with 6.0–6.1% for younger adults. Older adults with diabetes typically have higher individualized targets; discuss with your physician.
Does blood sugar rise naturally with age?
The post-meal glucose response widens slightly with age in healthy adults, about 5–7 mg/dL per decade in raw 2-hour postprandial readings (Chia et al., Circulation Research 2018). But after adjusting for body composition (BMI), the age-related rise dropped to nearly zero. Translation: most of what looks like “blood sugar rising with age” is actually changes in muscle mass and adiposity, not chronological age itself.
What is an optimal fasting glucose for longevity?
Longevity-focused researchers and clinicians often point to a fasting glucose under 90 mg/dL and an HbA1c under 5.4% as targets associated with lower long-term cardiovascular and metabolic risk. These are wellness targets, not medical diagnoses, and individual context matters. The four levers most consistently tied to hitting them are post-meal movement, resistance training, meal sequencing, and adequate sleep.
What is an alarming blood sugar level?
For adults without diabetes, a fasting reading at or above 126 mg/dL or a 2-hour post-meal reading at or above 200 mg/dL meets the diagnostic threshold for diabetes and warrants prompt medical review, not a lifestyle experiment. Readings well outside the reference range, or any reading paired with symptoms that feel wrong, are a reason to contact a clinician the same day rather than to self-manage. Your physician is the right source for what your individual numbers mean. The number that should prompt a conversation rather than alarm is a fasting glucose that has drifted from the 80s into the 100s over a couple of years; that trend is more informative than any single reading.
What brings down blood sugar immediately?
Two things have same-session evidence behind them: light movement and water. A 10–15 minute walk started within 30 minutes of eating measurably blunts the post-meal rise, because contracting muscle takes up glucose without needing additional insulin. Hydration helps because dilution and renal clearance both work in your favor. What does not work is anything marketed as a rapid fix; no product, spice, or vinegar shot produces a clinically meaningful acute drop. If you take glucose-lowering medication, follow your prescriber’s guidance rather than self-correcting, and treat any reading that feels alarming as a reason to call a clinician.
How can I support healthy blood sugar without medication?
For adults without diabetes who want to support healthy metabolic function, the four evidence-based lifestyle levers are: post-meal walking, resistance training for muscle-mediated glucose disposal, protein-and-fiber-first meal sequencing, and consistent sleep. Structure-function products like Evolv GLP-1 support the body’s own GLP-1 and GIP appetite pathways, which is a different lever from the four above.
These statements have not been evaluated by the Food and Drug Administration. This product is not intended to diagnose, treat, cure, or prevent any disease.